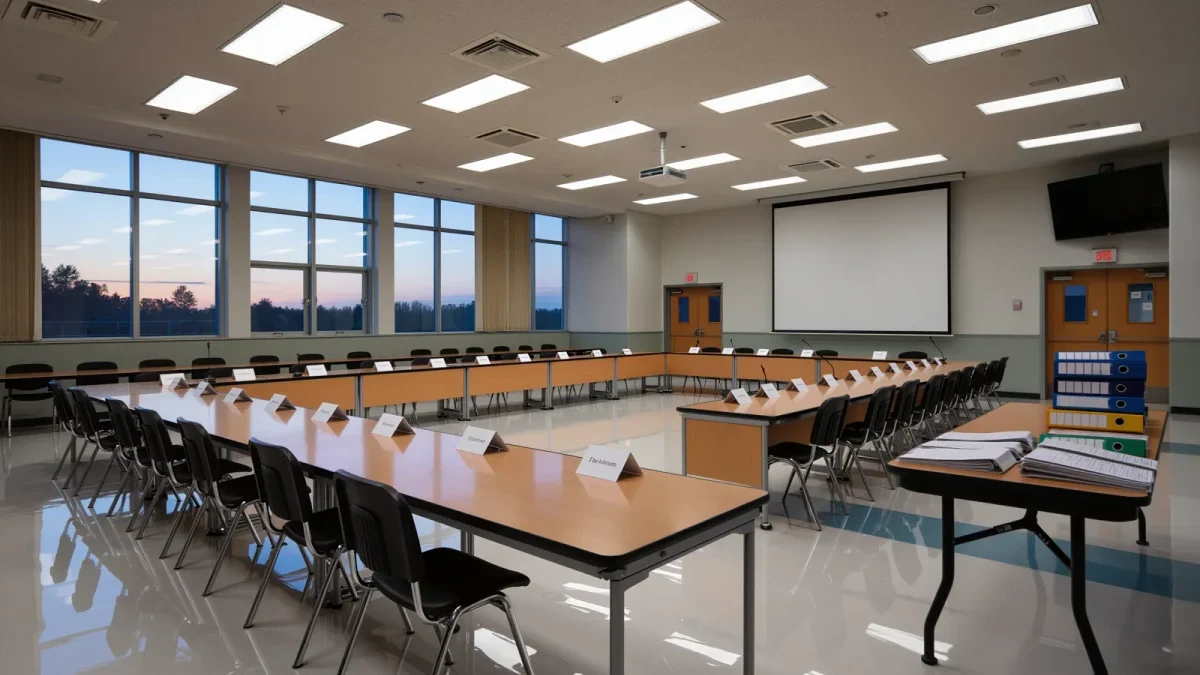
A school district budget is the single document that determines class sizes, staffing, and program survival, and public school spending in the United States totals over 850 billion dollars a year across districts. Every district must hold a public hearing on its budget and post the documents beforehand, though formats and timelines vary by state. With a map of the document and about an hour of reading, a parent can show up to the hearing knowing exactly where to point.
What are the three documents to request?
Districts publish a budget presentation, a line-item budget, and — midyear — the actual spending report. The presentation is the summary the board sees; the line-item version is where claims become numbers; the actuals report shows whether last year's plan held. Ask for all three, in PDF if possible. Many states also require posting them on the district website, and state education agencies keep district financial reports that allow comparison with similar districts.
How is a district budget structured?
Nearly all budgets break along the same seams. Understanding them turns a long spreadsheet into five readable chunks.
| Section | What it holds | What to look for |
|---|---|---|
| Revenue | Local, state, and federal sources | Shifts in state share; expiring federal grants |
| Personnel | Salaries and benefits, usually 75-85% of spending | Position counts, not just dollar totals |
| Operations | Transportation, food, maintenance, utilities | Deferred maintenance lines |
| Programs | Special education, English learners, athletics, arts | Cuts hidden inside vague line names |
| Debt and reserves | Loan payments and fund balance | Reserves dropping below board policy levels |
Why do salary and benefit lines dominate?
Personnel costs typically absorb 75 to 85 percent of a district's general fund because education is a labor-intensive service. That structural fact explains most budget drama: when revenue grows slower than health insurance and step-and-lane salary increases, something else must shrink. Watch the position count table rather than the salary total. A flat budget with fewer positions means larger classes even if no one calls it a cut.
What is the difference between the general fund and the others?
The general fund is the pot that pays for day-to-day instruction and the one hearings usually concern. Capital funds pay for buildings and cannot legally fund salaries in most states. Food service and transportation often sit in separate funds with their own revenue. A district can look rich in capital money while cutting teachers, which sounds contradictory until you read the fund structure. When an administrator says "we can't move that money," the fund walls are usually the reason.
Which revenue numbers deserve a second look?
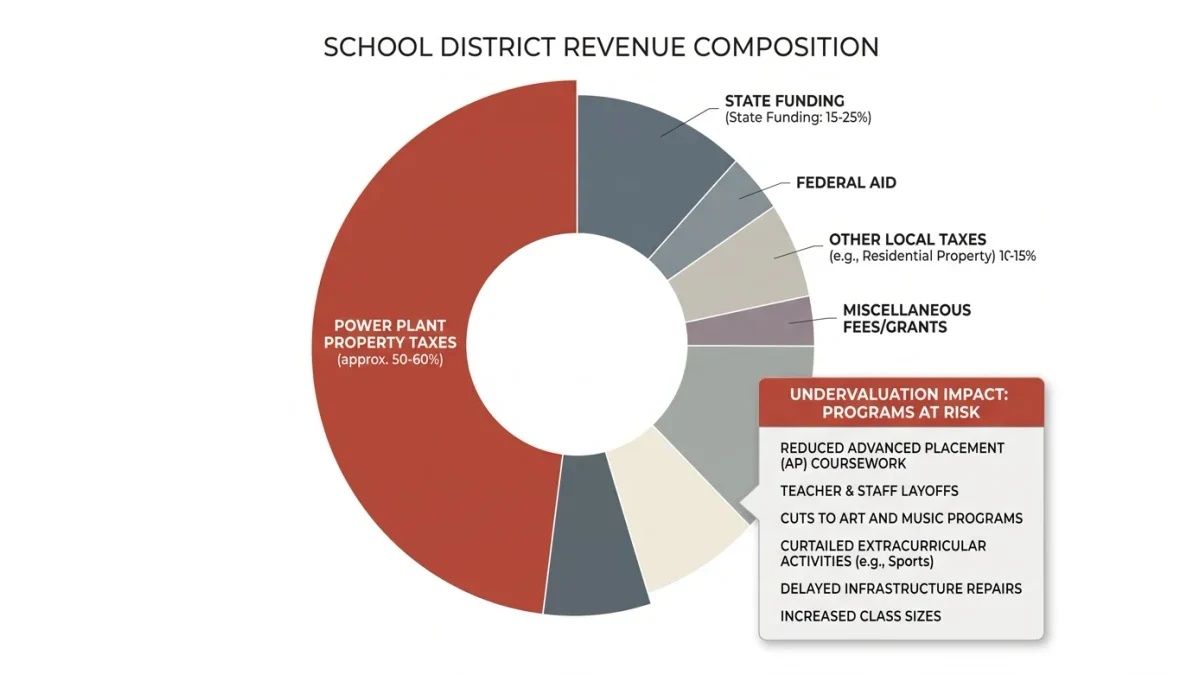
Three, in most districts. First, the state share: state funding formulas change with legislatures, and a district whose state aid is flat while costs rise is being squeezed invisibly. Second, local property tax revenue, which depends on assessment cycles and levy caps. Third, federal funds, including Title I and IDEA money that is restricted to specific purposes. Note especially whether one-time federal relief dollars were folded into recurring costs — a practice that produced widespread fiscal cliffs once those funds expired, as the U.S. Department of Education relief spending data documented through the program's end in 2024.
What is a fund balance, and why does it matter?
The fund balance is the district's unspent reserve, expressed as a percentage of the budget. Boards typically adopt a policy target — often around two months of operating costs. A balance falling toward zero signals future borrowing, delayed payments, or state oversight risk. A suspiciously high balance invites the opposite question: why is money sitting unused while programs plead for funds? Either direction, the number tells you where the district's fiscal stress actually sits.
How do you prepare comments for the hearing?
- Find the hearing date and public-comment rules on the district website at least two weeks ahead.
- Pull the line-item budget and locate the programs you care about across two years to see real change, not rhetoric.
- Write one specific point with a number — a position count, a per-pupil figure, a reserve percentage.
- Prepare a one-sentence ask: restore a line, postpone a decision, publish a breakdown.
- Practice once with a timer; most boards cap comments at two or three minutes.
What makes a public comment land?
Boards hear general frustration constantly and tune it out. Specific, sourced, calm comments get repeated by board members in later discussions. "The line-item budget shows intervention teachers falling from 14 to 9 positions while the presentation describes flat staffing" does more than any applause line. Bring the page number. If the answer you get is vague, the follow-up question — "which fund does that come from?" — is always in order.
What happens after the hearing?
The board votes on a final budget, often weeks later, and states set the deadline, commonly before the fiscal year starts on July 1. Approved budgets get amended during the year, and most boards must approve each revision in a public meeting. That means budget season never truly closes: the midyear actuals report is the moment to check what really happened against what was promised at the hearing you attended.
Which line items hide the real story?
A few lines deserve disproportionate skepticism because they concentrate decisions. Substitute teacher spending that balloons year over year signals staffing instability no slide mentions. Curriculum and technology adoption lines, often one-time costs, can quietly become recurring license fees. Professional development amounts tell you what the district is prioritizing pedagogically. And special education tuition — what a district pays to place high-need students in external programs — is the fastest-growing category in many states and frequently explains an otherwise mysterious structural deficit. When a presentation blames "rising costs," ask which specific lines rose; the honest answers are usually health insurance, special education tuition, and transportation contracts.
It also pays to compare per-pupil figures rather than totals. A district with falling enrollment can raise total spending while spending less per student, and the reverse happens in growing districts. Divide the general fund by enrollment for the current and prior year, and note whether the district counts enrollment on October 1 or averages daily attendance, because the denominator changes the arithmetic.
Where can you compare your district with others?
State education agency financial portals publish standardized district reports, and the U.S. Department of Education collects district finance data nationally. Comparing per-pupil spending and staffing ratios with demographically similar districts nearby is the fastest reality check on claims that a budget is unusually lean or unusually generous. Enrollment trends matter here too, since two districts with identical budgets face very different arithmetic when one is growing and one is shrinking.